
10K Pace Chart
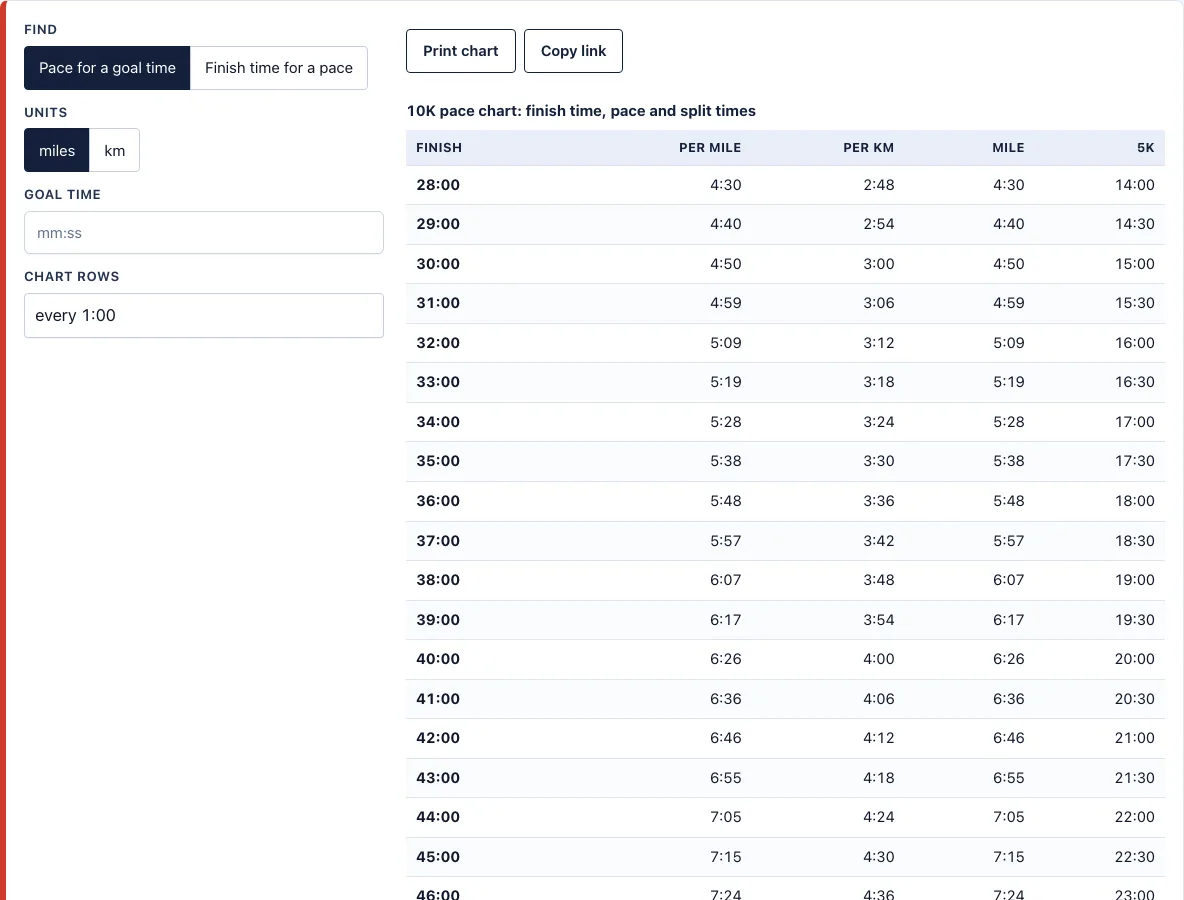
Find the pace for any 10K time from 28 minutes to 1:30, or type a goal time.
| Finish | Per mile | Per km | Mile | 5K |
|---|---|---|---|---|
| 28:00 | 4:30 | 2:48 | 4:30 | 14:00 |
| 29:00 | 4:40 | 2:54 | 4:40 | 14:30 |
| 30:00 | 4:50 | 3:00 | 4:50 | 15:00 |
| 31:00 | 4:59 | 3:06 | 4:59 | 15:30 |
| 32:00 | 5:09 | 3:12 | 5:09 | 16:00 |
| 33:00 | 5:19 | 3:18 | 5:19 | 16:30 |
| 34:00 | 5:28 | 3:24 | 5:28 | 17:00 |
| 35:00 | 5:38 | 3:30 | 5:38 | 17:30 |
| 36:00 | 5:48 | 3:36 | 5:48 | 18:00 |
| 37:00 | 5:57 | 3:42 | 5:57 | 18:30 |
| 38:00 | 6:07 | 3:48 | 6:07 | 19:00 |
| 39:00 | 6:17 | 3:54 | 6:17 | 19:30 |
| 40:00 | 6:26 | 4:00 | 6:26 | 20:00 |
| 41:00 | 6:36 | 4:06 | 6:36 | 20:30 |
| 42:00 | 6:46 | 4:12 | 6:46 | 21:00 |
| 43:00 | 6:55 | 4:18 | 6:55 | 21:30 |
| 44:00 | 7:05 | 4:24 | 7:05 | 22:00 |
| 45:00 | 7:15 | 4:30 | 7:15 | 22:30 |
| 46:00 | 7:24 | 4:36 | 7:24 | 23:00 |
| 47:00 | 7:34 | 4:42 | 7:34 | 23:30 |
| 48:00 | 7:43 | 4:48 | 7:43 | 24:00 |
| 49:00 | 7:53 | 4:54 | 7:53 | 24:30 |
| 50:00 | 8:03 | 5:00 | 8:03 | 25:00 |
| 51:00 | 8:12 | 5:06 | 8:12 | 25:30 |
| 52:00 | 8:22 | 5:12 | 8:22 | 26:00 |
| 53:00 | 8:32 | 5:18 | 8:32 | 26:30 |
| 54:00 | 8:41 | 5:24 | 8:41 | 27:00 |
| 55:00 | 8:51 | 5:30 | 8:51 | 27:30 |
| 56:00 | 9:01 | 5:36 | 9:01 | 28:00 |
| 57:00 | 9:10 | 5:42 | 9:10 | 28:30 |
| 58:00 | 9:20 | 5:48 | 9:20 | 29:00 |
| 59:00 | 9:30 | 5:54 | 9:30 | 29:30 |
| 1:00:00 | 9:39 | 6:00 | 9:39 | 30:00 |
| 1:01:00 | 9:49 | 6:06 | 9:49 | 30:30 |
| 1:02:00 | 9:59 | 6:12 | 9:59 | 31:00 |
| 1:03:00 | 10:08 | 6:18 | 10:08 | 31:30 |
| 1:04:00 | 10:18 | 6:24 | 10:18 | 32:00 |
| 1:05:00 | 10:28 | 6:30 | 10:28 | 32:30 |
| 1:06:00 | 10:37 | 6:36 | 10:37 | 33:00 |
| 1:07:00 | 10:47 | 6:42 | 10:47 | 33:30 |
| 1:08:00 | 10:57 | 6:48 | 10:57 | 34:00 |
| 1:09:00 | 11:06 | 6:54 | 11:06 | 34:30 |
| 1:10:00 | 11:16 | 7:00 | 11:16 | 35:00 |
| 1:11:00 | 11:26 | 7:06 | 11:26 | 35:30 |
| 1:12:00 | 11:35 | 7:12 | 11:35 | 36:00 |
| 1:13:00 | 11:45 | 7:18 | 11:45 | 36:30 |
| 1:14:00 | 11:55 | 7:24 | 11:55 | 37:00 |
| 1:15:00 | 12:04 | 7:30 | 12:04 | 37:30 |
| 1:16:00 | 12:14 | 7:36 | 12:14 | 38:00 |
| 1:17:00 | 12:24 | 7:42 | 12:24 | 38:30 |
| 1:18:00 | 12:33 | 7:48 | 12:33 | 39:00 |
| 1:19:00 | 12:43 | 7:54 | 12:43 | 39:30 |
| 1:20:00 | 12:52 | 8:00 | 12:52 | 40:00 |
| 1:21:00 | 13:02 | 8:06 | 13:02 | 40:30 |
| 1:22:00 | 13:12 | 8:12 | 13:12 | 41:00 |
| 1:23:00 | 13:21 | 8:18 | 13:21 | 41:30 |
| 1:24:00 | 13:31 | 8:24 | 13:31 | 42:00 |
| 1:25:00 | 13:41 | 8:30 | 13:41 | 42:30 |
| 1:26:00 | 13:50 | 8:36 | 13:50 | 43:00 |
| 1:27:00 | 14:00 | 8:42 | 14:00 | 43:30 |
| 1:28:00 | 14:10 | 8:48 | 14:10 | 44:00 |
| 1:29:00 | 14:19 | 8:54 | 14:19 | 44:30 |
| 1:30:00 | 14:29 | 9:00 | 14:29 | 45:00 |
Recent
Your last 10 settings, saved only in this browser. Nothing is uploaded.
How to use the 10K pace chart
- Choose a mode above the chart. Pick “Pace for a goal time” if you know the finish time you want, or “Finish time for a pace” if you know the pace you plan to hold.
- Type your value in the box. For a goal time, enter hours, minutes and seconds, such as 52:30 or 1:10:00. For a pace, enter minutes and seconds per mile or per kilometre.
- Read the answer. It shows the pace per mile and the pace per kilometre, and the closest row in the chart is highlighted.
- Scroll through the chart to see nearby finish times. Each row lists the finish time, pace per mile, pace per km, and the elapsed time at the mile and at 5K.
- Use the miles / km switch to choose whether a pace you type, and the big answer, are per mile or per km. The chart always shows both, and your choice is remembered in this browser.
Rows are listed from 28:00 to 1:30:00 and can be spaced every 0:30, 1:00 or 2:00. Use the Print chart button to print only the chart, or the Copy link button to share or bookmark your exact result.
The two modes answer opposite questions. Use the goal-time mode when you are planning a race, and the pace mode when you want to see what a pace you trained at would finish in.
What pace is a 1 hour 10K?
A 1 hour 10K is a finish time of 1:00:00, which means a pace of 9:39 per mile or 6:00 per kilometre. The rule behind this is that pace equals total time divided by distance. Pace is the time it takes to cover one unit of distance, so a 60-minute 10K divided by 10 km gives 6:00 per km.
Pace is calculated on even splits, where every mile or kilometre takes the same time. The chart assumes this, so the numbers are a steady-effort target rather than a race plan with fast and slow sections. Other finish times follow the same rule. A 40:00 10K is 6:26 per mile and 4:00 per km, while a 50:00 10K is 8:03 per mile and 5:00 per km.
How many miles is a 10K?
A 10K is 10 kilometres, which is 6.21 miles. Because the race distance is fixed in kilometres, the per-mile pace is always a bigger number than the per-km pace for the same finish time. A 1:10:00 finish is 7:00 per km, which converts to 11:16 per mile.
To convert between the two, use the same finish time and the distance in each unit. Divide the finish time in minutes by 6.21 to get minutes per mile, or divide by 10 to get minutes per km. Both columns in a row describe the same finish time.
What is a good 10K time?
A good 10K time depends on your experience, your training and what you want from the race. There is no single standard that fits every runner. Pick a finish time that is a realistic step up from your recent runs, then use the chart to see the pace it needs. A 40:00 10K, for example, needs 6:26 per mile or 4:00 per km, so you can judge whether that pace is within reach.
How do I read the 10K pace chart?
Each row lists a finish time, then the pace per mile, the pace per km, and the elapsed time at the mile and at 5K. The 5K column is the most useful check during a race, because it shows where you should be at the halfway point of the distance. Rows can be spaced every 0:30, 1:00 or 2:00, so choose the spacing that gives you the finish times you care about.
Frequently asked questions
Can I print the chart?
Yes. Use the Print chart button, which prints only the chart and leaves out the rest of the page. The printed copy keeps both pace units.
Does the tool save what I type?
Nothing you type is uploaded or stored on a server. Your settings are kept in the page address, so the Copy link button can share or bookmark the exact result you are viewing.
What does the 5K split mean?
The 5K split is the elapsed time at the 5 km point of your race. For an even pace, it is half of your finish time, so a 1:10:00 10K has a 5K split of 35:00. Checking it during a race helps you see whether you are on target at the halfway point.
What if my goal time is not in the chart?
Type your exact goal time in “Pace for a goal time” mode, and the answer will show the exact pace. The chart highlights the closest row, so you can see the nearest listed time.
Can I switch between miles and kilometres?
Yes. The miles / km switch sets whether the pace you type and the main answer are per mile or per km; the chart always lists both, and the switch is remembered in this browser.
What pace is a 50 minute 10K?
A 50:00 10K needs 8:03 per mile or 5:00 per km. Its 5K split is 25:00 at an even pace, which is half of the finish time.
Related tools
- Pace calculator — Use this when you want a quick pace for one specific time or distance.
- Marathon pace chart — Use this to plan pacing for a 26.2-mile race.
- Half marathon pace chart — Use this to plan pacing for a 13.1-mile race.
- 5K pace chart — Use this for shorter races of 5 km.
- Treadmill pace chart — Use this to set treadmill speeds for your target pace.
- 10K training plan — Use this to build the weekly runs that prepare you for a 10K.
- Race time predictor — Use this to estimate a finish time from a recent race result.
- Race pace calculator — Use this to work out pacing for races at other distances.