
5K Pace Chart
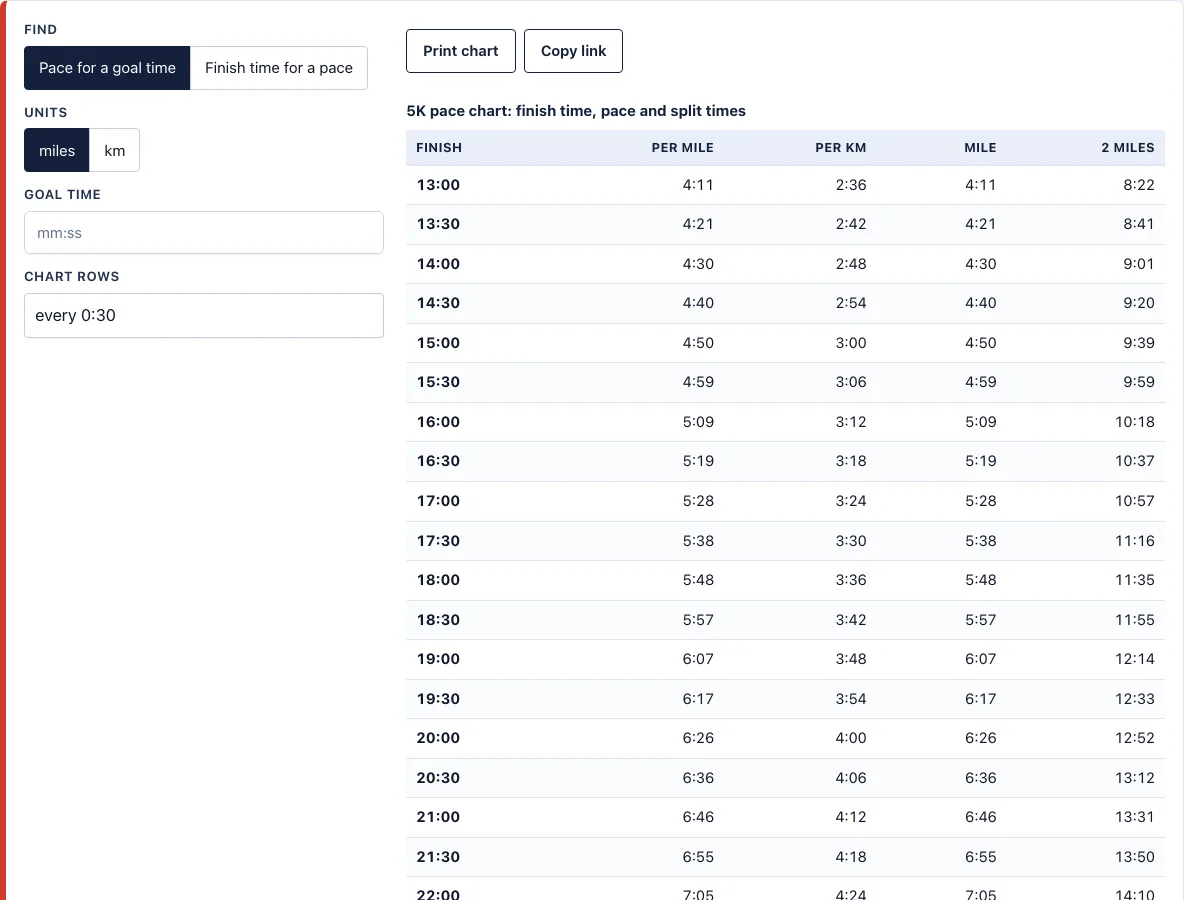
See the pace for every 5K time from 13 to 50 minutes, or type your goal time.
| Finish | Per mile | Per km | Mile | 2 miles |
|---|---|---|---|---|
| 13:00 | 4:11 | 2:36 | 4:11 | 8:22 |
| 13:30 | 4:21 | 2:42 | 4:21 | 8:41 |
| 14:00 | 4:30 | 2:48 | 4:30 | 9:01 |
| 14:30 | 4:40 | 2:54 | 4:40 | 9:20 |
| 15:00 | 4:50 | 3:00 | 4:50 | 9:39 |
| 15:30 | 4:59 | 3:06 | 4:59 | 9:59 |
| 16:00 | 5:09 | 3:12 | 5:09 | 10:18 |
| 16:30 | 5:19 | 3:18 | 5:19 | 10:37 |
| 17:00 | 5:28 | 3:24 | 5:28 | 10:57 |
| 17:30 | 5:38 | 3:30 | 5:38 | 11:16 |
| 18:00 | 5:48 | 3:36 | 5:48 | 11:35 |
| 18:30 | 5:57 | 3:42 | 5:57 | 11:55 |
| 19:00 | 6:07 | 3:48 | 6:07 | 12:14 |
| 19:30 | 6:17 | 3:54 | 6:17 | 12:33 |
| 20:00 | 6:26 | 4:00 | 6:26 | 12:52 |
| 20:30 | 6:36 | 4:06 | 6:36 | 13:12 |
| 21:00 | 6:46 | 4:12 | 6:46 | 13:31 |
| 21:30 | 6:55 | 4:18 | 6:55 | 13:50 |
| 22:00 | 7:05 | 4:24 | 7:05 | 14:10 |
| 22:30 | 7:15 | 4:30 | 7:15 | 14:29 |
| 23:00 | 7:24 | 4:36 | 7:24 | 14:48 |
| 23:30 | 7:34 | 4:42 | 7:34 | 15:08 |
| 24:00 | 7:43 | 4:48 | 7:43 | 15:27 |
| 24:30 | 7:53 | 4:54 | 7:53 | 15:46 |
| 25:00 | 8:03 | 5:00 | 8:03 | 16:06 |
| 25:30 | 8:12 | 5:06 | 8:12 | 16:25 |
| 26:00 | 8:22 | 5:12 | 8:22 | 16:44 |
| 26:30 | 8:32 | 5:18 | 8:32 | 17:04 |
| 27:00 | 8:41 | 5:24 | 8:41 | 17:23 |
| 27:30 | 8:51 | 5:30 | 8:51 | 17:42 |
| 28:00 | 9:01 | 5:36 | 9:01 | 18:01 |
| 28:30 | 9:10 | 5:42 | 9:10 | 18:21 |
| 29:00 | 9:20 | 5:48 | 9:20 | 18:40 |
| 29:30 | 9:30 | 5:54 | 9:30 | 18:59 |
| 30:00 | 9:39 | 6:00 | 9:39 | 19:19 |
| 30:30 | 9:49 | 6:06 | 9:49 | 19:38 |
| 31:00 | 9:59 | 6:12 | 9:59 | 19:57 |
| 31:30 | 10:08 | 6:18 | 10:08 | 20:17 |
| 32:00 | 10:18 | 6:24 | 10:18 | 20:36 |
| 32:30 | 10:28 | 6:30 | 10:28 | 20:55 |
| 33:00 | 10:37 | 6:36 | 10:37 | 21:15 |
| 33:30 | 10:47 | 6:42 | 10:47 | 21:34 |
| 34:00 | 10:57 | 6:48 | 10:57 | 21:53 |
| 34:30 | 11:06 | 6:54 | 11:06 | 22:13 |
| 35:00 | 11:16 | 7:00 | 11:16 | 22:32 |
| 35:30 | 11:26 | 7:06 | 11:26 | 22:51 |
| 36:00 | 11:35 | 7:12 | 11:35 | 23:10 |
| 36:30 | 11:45 | 7:18 | 11:45 | 23:30 |
| 37:00 | 11:55 | 7:24 | 11:55 | 23:49 |
| 37:30 | 12:04 | 7:30 | 12:04 | 24:08 |
| 38:00 | 12:14 | 7:36 | 12:14 | 24:28 |
| 38:30 | 12:24 | 7:42 | 12:24 | 24:47 |
| 39:00 | 12:33 | 7:48 | 12:33 | 25:06 |
| 39:30 | 12:43 | 7:54 | 12:43 | 25:26 |
| 40:00 | 12:52 | 8:00 | 12:52 | 25:45 |
| 40:30 | 13:02 | 8:06 | 13:02 | 26:04 |
| 41:00 | 13:12 | 8:12 | 13:12 | 26:24 |
| 41:30 | 13:21 | 8:18 | 13:21 | 26:43 |
| 42:00 | 13:31 | 8:24 | 13:31 | 27:02 |
| 42:30 | 13:41 | 8:30 | 13:41 | 27:22 |
| 43:00 | 13:50 | 8:36 | 13:50 | 27:41 |
| 43:30 | 14:00 | 8:42 | 14:00 | 28:00 |
| 44:00 | 14:10 | 8:48 | 14:10 | 28:19 |
| 44:30 | 14:19 | 8:54 | 14:19 | 28:39 |
| 45:00 | 14:29 | 9:00 | 14:29 | 28:58 |
| 45:30 | 14:39 | 9:06 | 14:39 | 29:17 |
| 46:00 | 14:48 | 9:12 | 14:48 | 29:37 |
| 46:30 | 14:58 | 9:18 | 14:58 | 29:56 |
| 47:00 | 15:08 | 9:24 | 15:08 | 30:15 |
| 47:30 | 15:17 | 9:30 | 15:17 | 30:35 |
| 48:00 | 15:27 | 9:36 | 15:27 | 30:54 |
| 48:30 | 15:37 | 9:42 | 15:37 | 31:13 |
| 49:00 | 15:46 | 9:48 | 15:46 | 31:33 |
| 49:30 | 15:56 | 9:54 | 15:56 | 31:52 |
| 50:00 | 16:06 | 10:00 | 16:06 | 32:11 |
Recent
Your last 10 settings, saved only in this browser. Nothing is uploaded.
How to use the 5K pace chart
- Look at the chart below the tool: it lists every 5K finish time from 13:00 to 50:00.
- Choose one of the two options above the chart:
- Pace for a goal time if you know the finish time you want.
- Finish time for a pace if you know the pace you can hold.
- Type your finish time (for example, 25:00) or your pace (for example, 8:03) into the box.
- Read the answer. It shows the pace per mile and per km, and the closest row in the chart is highlighted.
- Use the miles / km switch to choose whether a pace you type, and the big answer, are per mile or per km. The chart always shows both, and your choice is remembered in this browser.
The chart rows can be set to every 0:15, 0:30 or 1:00, and each row shows the pace per mile, the pace per km, and the elapsed time at the mile and at 2 miles. To print only the chart, press Print chart. To share or bookmark the exact result you are looking at, press Copy link, because the settings are kept in the page address.
The two options answer different questions. Pace for a goal time suits race planning, when you have a finish time in mind. Finish time for a pace suits a training check, when you already know the pace from a run and want to see the time it gives.
What pace is a 25 minute 5K?
A 25 minute 5K needs a pace of 5:00 per kilometre, or 8:03 per mile. Pace is the time it takes to cover one unit of distance, so you find it by dividing the finish time by the distance.
The chart assumes even pace, meaning every kilometre or mile takes the same time. For 25:00 over 5 km, that is 25 ÷ 5 = 5:00 per km. Over 3.11 miles, it is about 8:03 per mile. Other examples from the chart:
- 20:00 5K: 6:26 per mile, 4:00 per km
- 30:00 5K: 9:39 per mile, 6:00 per km
- 35:00 5K: 11:16 per mile, 7:00 per km
Every extra 5 minutes on the finish time adds 1:00 to the pace per km. Real races are rarely perfectly even, but a steady pace gives you a clear target for each part of the course.
How many miles is a 5K?
A 5K is 5 kilometres, which is 3.11 miles. The “5K” name comes from the distance in kilometres, so the mile figure is a conversion. One mile is about 1.609 kilometres, so 5 ÷ 1.609 ≈ 3.11.
The conversion also explains why the mile pace number is bigger than the km pace number. A mile is longer than a kilometre, so it takes more time. To turn a km pace into a mile pace, multiply by 1.609. For example, 5:00 per km × 1.609 ≈ 8:03 per mile, which matches the chart.
What is a good 5K time?
A good 5K time depends on your fitness, your training and your goal, so there is no single standard that suits everyone. Pick a time that is a realistic step up from your recent runs, find that row on the chart, and check whether the pace feels manageable on your training runs. A first-time 5K runner who finishes steadily has also had a good result.
How do I read the 5K pace chart?
Each row is one finish time, and it lists the pace per mile and the pace per km for that time. The mile and 2-mile columns show your elapsed time at those points, so you can compare your watch against the chart during the race. The rows step up in fixed amounts, so a time between two rows is best read from the answer box above the chart.
Frequently asked questions
What pace is a 20 minute 5K?
A 20:00 5K needs 6:26 per mile or 4:00 per km. The 20:00 row in the chart lists both figures, and the answer box gives the exact pace for any time you type.
What pace is a 35 minute 5K?
A 35:00 5K needs 11:16 per mile or 7:00 per km. Each extra 5 minutes on the finish time adds 1:00 to the pace per km, so the pace rises in clear steps as the time goes up.
Can I print the chart?
Yes. Press Print chart to print only the chart, without the rest of the page. The printed table keeps both the pace per mile and the pace per km for each row.
Does the chart show kilometre paces too?
Yes. Each row shows the pace per km next to the pace per mile. The miles / km switch sets the unit of the pace you type and of the main answer, and the table always shows both.
Do I need to sign up to use it?
No. The tool is free and runs in your browser. There is no account or sign-up, and nothing you type is uploaded or stored on a server, so you can use it as often as you like.
Will the chart work on my phone?
Yes. The page works on phones. On small screens, the tables scroll sideways inside their box, so swipe across to see every column, including the 2-mile split.
Related tools
- Pace calculator: Use it to work out pace for any distance and time, not only 5K.
- Marathon pace chart: Use it when you are planning paces for a 26.2-mile race.
- Half marathon pace chart: Use it to plan paces for a 13.1-mile race.
- 10K pace chart: Use it when your race is 10 km instead of 5 km.
- Treadmill pace chart: Use it to set treadmill speeds that match your target pace.
- 5K training plan: Use it to build the weekly runs that get you ready for your target time.
- Race time predictor: Use it to estimate a finish time from a recent race result.
- Race pace calculator: Use it to work out the pace you need for a specific race goal.