
Average 10K Time
See the typical 10K time for every age band, then check where your own time sits.
Free · runs in your browser · nothing is uploaded
Recent
Your last 10 settings, saved only in this browser. Nothing is uploaded.
This average 10k time page shows the typical finish time for 10K road races, split by sex and age group, and places your own time against it. Across 335,737 road-race finishers in Switzerland from 1999 to 2019, the median 10K time was 0:51:57: 0:48:48 for men and 0:56:51 for women. These are finishers of road races in one country, not all runners, so fun runs and races in other countries will differ. Enter your sex, age and time to see your place in that group.
Use the tool below by entering your sex, age and 10K time, or leave the time blank to read the figures for your group alone. The page also shows the spread of times, so you can see how wide the typical range is for your age band.
How to use the average 10k time tool
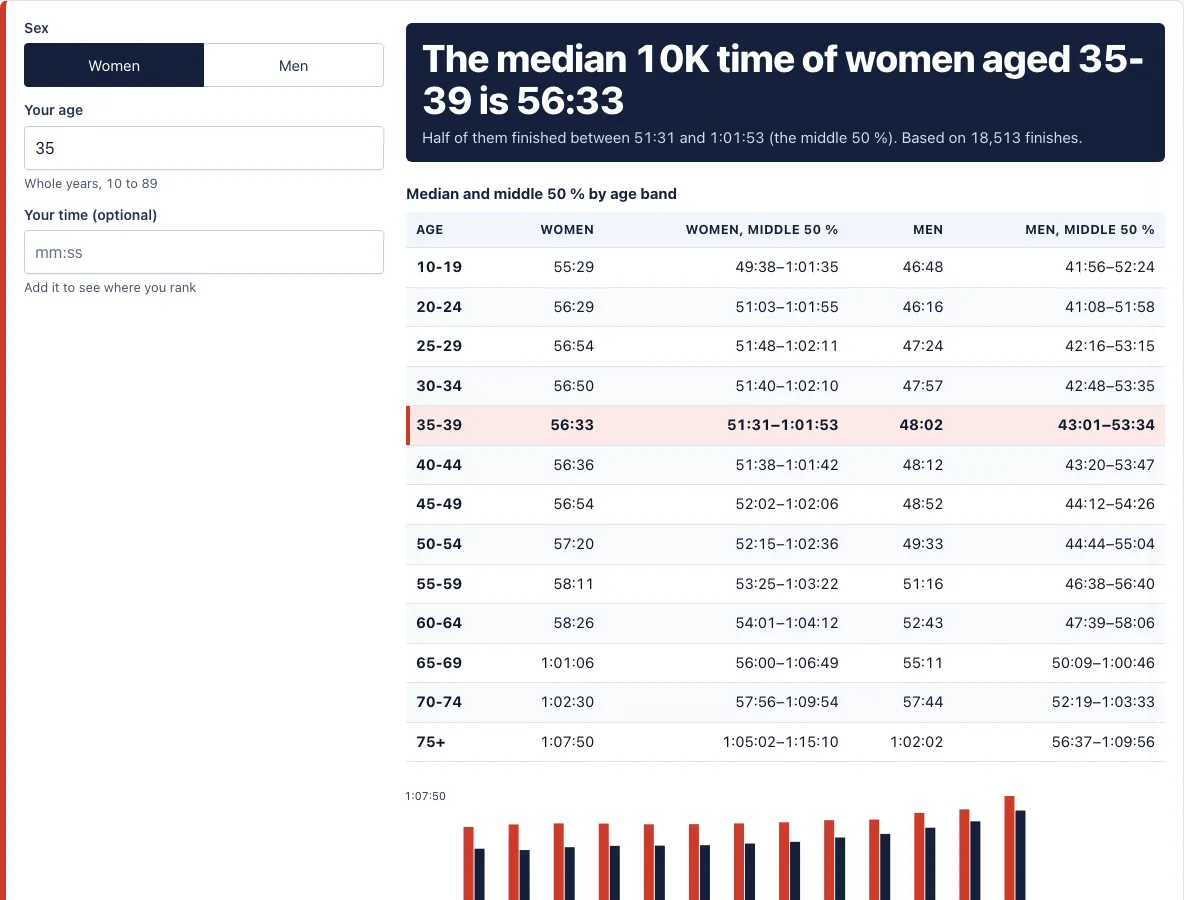
- Start with the table at the top. It lists the median for women and for men in each age band, so you can find your band before you enter anything.
- Choose Women or Men, then enter your age, from 10 to 89.
- Optionally enter your 10K finish time.
- Read the median and the middle 50 % for your age group. The middle 50 % is the range from the 25th to the 75th percentile finish time.
- If you entered a time, read the share of finishers you were faster than.
- Read your age-grade percentage, which uses the USATF MLDR / Alan Jones road age-grading tables (2025, CC0 data).
- Scroll to the chart and the tables by age band. For the times that reach 60, 70, 80 and 90 % age grade, open the age grade calculator.
The figures are our own statistics from the open Swiss road-race dataset of Witthöft et al., PLOS ONE 2025 (CC BY 4.0), covering 1999 to 2019 and finishers only. Read them as figures for road-race finishers in one country, not for all runners. Age grades use the USATF MLDR / Alan Jones road age-grading tables (2025). The tool runs in your browser, nothing you enter is uploaded, and it is free.
Change the sex or the age and every figure updates at once. The result shows the group median first, then the middle 50 %, then the share of finishers you were faster than if you entered a time. The link button copies your exact inputs so you can open the same result later.
Reading the result well. Compare yourself with your own sex and age band first, because the all-ages median mixes groups that run at very different speeds. Treat one race as one data point: course, weather and the day you had all move a finish time. If you want a target rather than a position, pick a time from the age-grade list and use the race pace calculator to turn it into a pace for each kilometre or mile.
What is the average 10k time?
The median 10K finish time across all finishers is 0:51:57, and the mean is 0:52:34. The middle 50 % ran between 0:45:55 and 0:58:17. The fastest 10 % finished in 0:41:06 or less, and the slowest 10 % took longer than 1:04:23.
What is a good 10k time by age?
Good is set by age-grade percentage here. For a woman aged 35, the time that reaches 60 % age grade is 0:48:38, and 70 % is 0:41:41. The times for 80 % and 90 % are 0:36:29 and 0:32:26.
How does the average 10k time differ for men and women?
Across all ages the median is 0:48:48 for men and 0:56:51 for women. In the 20 to 24 band the medians are 0:46:16 for men and 0:56:29 for women. In the 60 to 64 band they are 0:52:43 for men and 0:58:26 for women, so the gap is smaller at the older age.
How long does a 10K take at each age?
Among men, the medians are 0:47:57 at 30 to 34, 0:48:12 at 40 to 44 and 0:49:33 at 50 to 54. Among women, they are 0:56:50 at 30 to 34, 0:56:36 at 40 to 44 and 0:57:20 at 50 to 54. The medians in the 30s and 40s are close for both sexes.
Why the median and not the mean?
A few very slow finishes pull the mean above the median, so the median describes the typical finisher better. Half of the finishers ran faster than the median and half ran slower. The page also shows the 25th and 75th percentile times. Together they give the middle 50 %, the range in which half of all finishers ended up, so you can see how wide “normal” is for your group before you judge your own time.
What these figures can and cannot tell you
The numbers come from finishers of organised road races in one country between 1999 and 2019. They leave out runners who did not finish, runners who never enter races, and any race outside that dataset. A median from this data is a fair picture of road-race finishers in that period, not a rule for every runner in every country. If your time sits below the median for your group, that says nothing about your health or your potential: a position in a table is not a score of how well you trained.
How wide is the spread of 10K times?
The fastest 10 % of all finishers ran 0:41:06 or less, and the slowest 10 % took longer than 1:04:23, a gap of more than twenty-three minutes. For men the marks are 0:39:31 and 1:00:28, and for women they are 0:47:01 and 1:07:47. With a spread this wide, a time a few minutes either side of the median is ordinary.
How this tool works and where the numbers come from
Medians and percentiles are our own statistics computed from the open Swiss road-race dataset of Witthöft et al. (PLOS ONE 2025, CC BY 4.0): road races in Switzerland from 1999 to 2019, finishers aged 10 to 89, 10K. They describe finishers in one country, not all runners. The share of finishers faster than your time is interpolated between stored percentiles. Age grade uses the 2025 road tables of Alan Jones / USATF MLDR (CC0).
Sources
Frequently asked questions
What is the average 10k time for men?
The men’s median for all ages is 0:48:48, and the middle 50 % runs from 0:43:42 to 0:54:34. The 30 to 34 band has a median of 0:47:57.
What is the average 10k time for women?
The women’s median for all ages is 0:56:51, and the middle 50 % runs from 0:51:46 to 1:02:12. The 20 to 24 band has a median of 0:56:29.
How does a 10K time compare with a 5K time?
The medians are 0:51:57 for 10K and 0:29:57 for 5K, but these are different groups of finishers, so do not divide one by the other. To predict one distance from a result at another, use the race time predictor.
What is a 10k best time?
The dataset holds medians and percentiles, not best times. The fastest 10 % of all finishers ran in 0:41:06 or less, which is one way to read a strong time.
What are typical 10k times?
Typical times fall in the middle 50 % of finishers, which runs from 0:45:55 to 0:58:17 across all ages and both sexes. Compare your time with your sex and age band in the table for a closer match.
Is a 50-minute 10K good?
It is faster than the median. In this dataset 42 % of all finishers ran faster than 0:50:00, so a 0:50:00 time put a runner ahead of 58 % of them, and the all-ages median is 0:51:57. For a closer reading, compare with your own sex and age band in the table.
How much do 10K times change between the 20s and the 50s?
For men the medians are 0:46:16 at 20 to 24 and 0:49:33 at 50 to 54. For women they are 0:56:29 and 0:57:20. The change is small in this range, and it grows after 60: 0:52:43 for men and 0:58:26 for women in the 60 to 64 band.
Related tools
- Average 5K time: Use this to compare a 5K time by age and sex.
- Average half marathon time: Use this to see how common each half marathon goal is.
- Race time predictor: Use this to predict a 10K from a 5K or half marathon result.
- Age grade calculator: Use this to turn any race time into an age-graded percentage.
- 10K training plan: Use this to build a plan for a faster 10K.
- 10K pace chart: Use this to see split times for your goal 10K time.