
Boston Marathon Elevation Profile and Pace Band
See the course profile and get a pace band whose splits follow the hills, with the total always equal to your goal time.
Recent
Your last 10 settings, saved only in this browser. Nothing is uploaded.
The Boston Marathon elevation profile shows a course that starts high in Hopkinton and ends near sea level in Boston, with a run of rolling climbs in the middle. This page draws the profile from the course route and public elevation data, and turns it into a free pace band: you enter a goal time and get a split for every mile that is a little slower on the climbs and a little faster on the descents.
The even-pace band on most pages simply divides your goal time by 26.2. On a net-downhill course with the Newton hills in the second half, that hides where the effort really goes. The band here keeps your total time exactly at the goal, and moves time between miles according to the grade of each stretch. The tool runs in your browser and stores nothing.
How to use the Boston Marathon pace band
- Type your goal finish time in Goal finish time, for example 3:30:00. The field accepts hours, minutes and seconds.
- Choose miles or kilometres in the unit switch. Mile bands have 27 rows, kilometre bands 43.
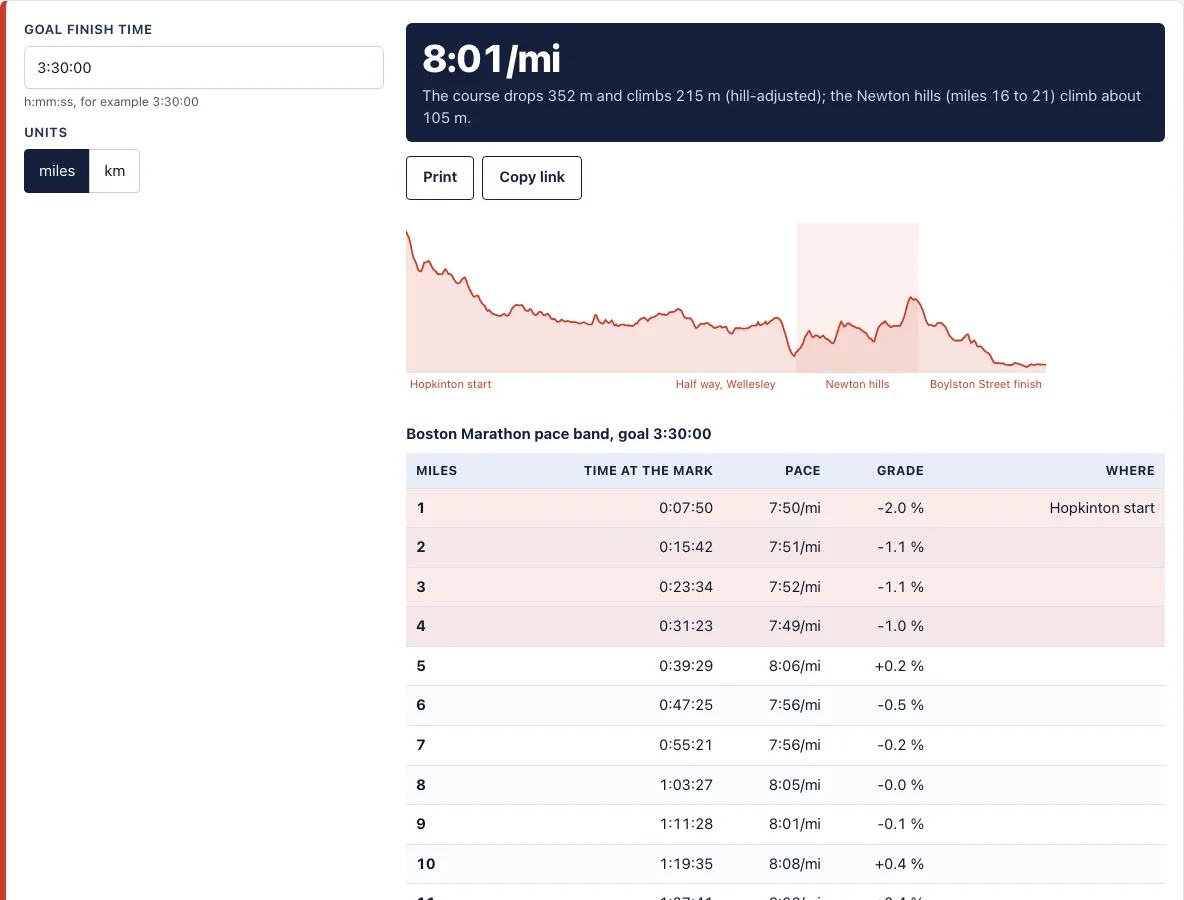
- Read the pace line at the top. It shows your average pace for the whole race, and under it the climb and descent of the course.
- Look at the elevation profile. The shaded block marks miles 16 to 21, the Newton hills, so you can see where the course turns uphill.
- Check the table. Each row shows the time you should reach at that mark, the pace for that stretch and its average grade. Rows with a grade of 1 % or more are shaded, so the hills are easy to find.
- Click Print for a copy to cut out and wear on your wrist, or Copy link to share the exact result with a training partner. Your settings are kept in the page address.
Pick the goal time you can really hold on flat ground, because the band only moves time between miles. It does not make a slower plan faster. If a split looks too aggressive, lower the goal time first and read the table again.
What does the Boston Marathon elevation profile look like?
The course is point to point. It starts in Hopkinton at about 140 m (460 ft) above sea level and finishes on Boylston Street at about 5 m. In the course data used here the route descends roughly 135 m overall, climbs about 215 m and descends about 350 m along the way. The first four miles drop steadily, miles 5 to 15 roll gently, there is a steep drop just before the Newton hills, and miles 16 to 21 climb in several steps toward the Heartbreak Hill area before the long descent into Boston.
The climb and descent figures come from smoothed public elevation data, so very short steep sections look flatter than they feel on the road. Treat the numbers as a planning guide, not as official course data.
How does a hill-adjusted pace band work?
For each stretch of the course the tool takes the grade, converts it into an effort factor with the Kay (2012) hill-running model, and gives the stretch a pace in proportion. A downhill boost of 0.6 is applied by default, because most road runners gain less on descents than elite runners in the study. The times are then scaled so they add up to your goal. Level ground at the same effort would be run at the flat pace; climbs are slower than that and descents faster.
Why is the Boston Marathon not a record course?
Because it is net downhill and the start and finish are far apart. Record rules for the marathon limit the net drop to 1 m per km, about 42 m for the whole race, and the finish may not be too far from the start in a straight line. Boston drops far more than that, which is why its fast times do not count as records. It also means the first miles feel easy, and the pace you hold early is the one you pay for on the Newton hills.
Where do the Newton hills start and where is Heartbreak Hill?
The Newton hills begin around mile 16, after a steep drop, and run to about mile 21 in Newton. Heartbreak Hill is the last of them, near mile 20.5 to 21, close to Boston College. The mile positions on this page are approximate.
Frequently asked questions
Is this the official Boston Marathon course data?
No. The route comes from OpenStreetMap contributors and the elevations from public terrain tiles, so the profile and the grades are approximations. The Boston Athletic Association publishes the official course and rules, and this site is not affiliated with it.
Does the band change my finish time?
No. The splits always add up to your goal time. Only the distribution between miles changes.
Can I make a hill-adjusted band for another race?
The RunPacePlan app does it from any GPX or TCX file, for free, and prints it as a wristband. The Android app is on Google Play; the iPhone version is not out yet.

What goal time should I enter?
The time you could run on a flat course at the same effort. If you qualified for Boston, use your qualifying time, or a little slower on a warm day. See Boston qualifying times for the standards.
Can I use the band commercially?
Yes. Anything you make with the tool is free to use, including commercially.
Does the page work on a phone?
Yes. The table scrolls sideways on small screens and the print view fits a wristband.
Related tools
- Boston qualifying times: Check the standard for your age group before you set a goal time.
- Marathon pace band: Make an even-pace band for any marathon goal time.
- Marathon pace chart: See paces for many finish times at once.
- Marathon training plan: Build the training plan that gets you to the start line.
- Treadmill incline calculator: Practise the hills indoors at the same effort.
- Race pace calculator: Compare goal times across distances before you pick a target.